
Living in a fairly mild growing environment like the Blue Mountains I feel lucky that when growing food plants I don’t have to plan like some do in much harsher climates. Counting out the days to harvest and working out a strict planting regime to gain the most from every growing sunlight hour and drop of rain fall from planting seed till harvesting seed is not really necessary here unless you are planning to be fully self sufficient.
Still – talking about the weather can be a serious subject when discussing it with Blue Mountains locals as the day to day weather patterns can be very changeable.
Because in the Blue Mountains we sit at the western edge of the Sydney basin on a raised land plateau that rises from almost sea level to a peak table level of 1000M (3300 feet) our weather tends to have a lot of variation. We get the significant air movement that comes from both the south and north western regions over the huge landmass of inland Australia. Generally the south winds bring cold and the north winds bring hot weather. We then also get touched by the coastal storms from the east and whatever the rest of Sydney is getting in the way of wind, sun and rain.
This highly variable range of influences can bring the proverbial ‘four seasons in one day’.
We have what I would call ‘lazy’ erratic seasons that are distinct but certainly not dramatically defined by transitions into four equal parts like most northern hemisphere seasons. They are variously defined by being warm, cold, wet, electrical (often with hail stones), windy and we have a significant later summer and autumn period of the year which has ‘very nice’ warm days and cool nights.
Indigenous Australians have some interesting observations about this. The traditional Dharawal people in the Sydney region classify the local weather into six specific seasons.
Dharawal seasons: http://www.bom.gov.au/iwk/index.shtml
See also – http://en.wikipedia.org/wiki/Indigenous_Australian_seasons
We have usually enough cooling hours per year to grow many cold weather fruits and plants and enough heat and sun (in protected local situations) to grow some subtropicals. One of the main issues we face is just selecting the best food options for the time of the year and then getting the seed in to the ground or pots and started at the right time to sync in with our local temperatures and rainfall patterns.
Planning your planting around the local weather
A useful place to start looking at how this affects what you can grow is to quickly make up a list of the plants you want to grow and then write down the minimum germination temp, the temp required for the fruit to set or the leaves to grow successfully and then the length of time from seed to harvest.
Seed companies and online resources often have the basic info required to do this listed in their catalogues in print or online. Another example would be services like Gardenate that work out these types of details for you in a very general way based on your general climate type.
Seed saving groups are a great place to get this type of local knowledge first hand from people doing this planning (and often with a long experience of doing it in your local area).
These lists once made up tend to be fairly consistent from year to year so it’s something you only really have to do once and then adjust as you gain more experience and learn more about the plants you are growing.
Weather information
You can the look at the Australian Bureau of Meteorology data for your area and then compare that with your planting list.
You can see all the tables for our Blue Mountains region here: http://www.bom.gov.au/climate/averages/tables/cw_063039.shtml
This data can help indicate what will grow when and for how long.
An example would be the air temperatures for tomatoes.
- For the flowers and fruit to set the air temperature needs to be above around 13C (55F) at night.
- The optimum daytime setting temperature for the fruit during the day is 21-29C (70-85F).
- Below around 13C ( 55F) and above about 32C (90F) the flowers and fruit will likely not set and just drop off the plant as the plant will start to suffer from cold or heat stress.
Temperatures
Here are the BOM calculated ‘mean’ temperature readings for the Blue Mountains taken in Katoomba from between 1981 & 2015. There are other weather stations available in the Blue Mountains and they do vary from these but only a small amount..eg. temperatures tend to be slightly warmer in the lower mountains.
| Blue Mountains – Katoomba | ||||||||||||
| Temperature | ||||||||||||
| Jan | Feb | Mar | Apr | May | Jun | Jul | Aug | Sep | Oct | Nov | Dec | |
| Highest temperature (°C) | 36.4 | 37.6 | 34 | 28.7 | 22.2 | 19.4 | 18.8 | 22 | 26.6 | 31.2 | 36 | 35 |
| Mean maximum temperature (°C) | 23.3 | 22.4 | 20.3 | 16.7 | 13.1 | 10 | 9.4 | 11.2 | 14.6 | 17.7 | 20.3 | 22.4 |
| Mean minimum temperature (°C) | 12.8 | 12.9 | 11.4 | 8.7 | 6.1 | 3.7 | 2.6 | 3.3 | 5.4 | 7.7 | 9.9 | 11.7 |
| Lowest temperature (°C) | 4.2 | 3.9 | 1.7 | -0.5 | -2.8 | -8.2 | -5.4 | -5.6 | -2.8 | -1 | -0.1 | 2.4 |
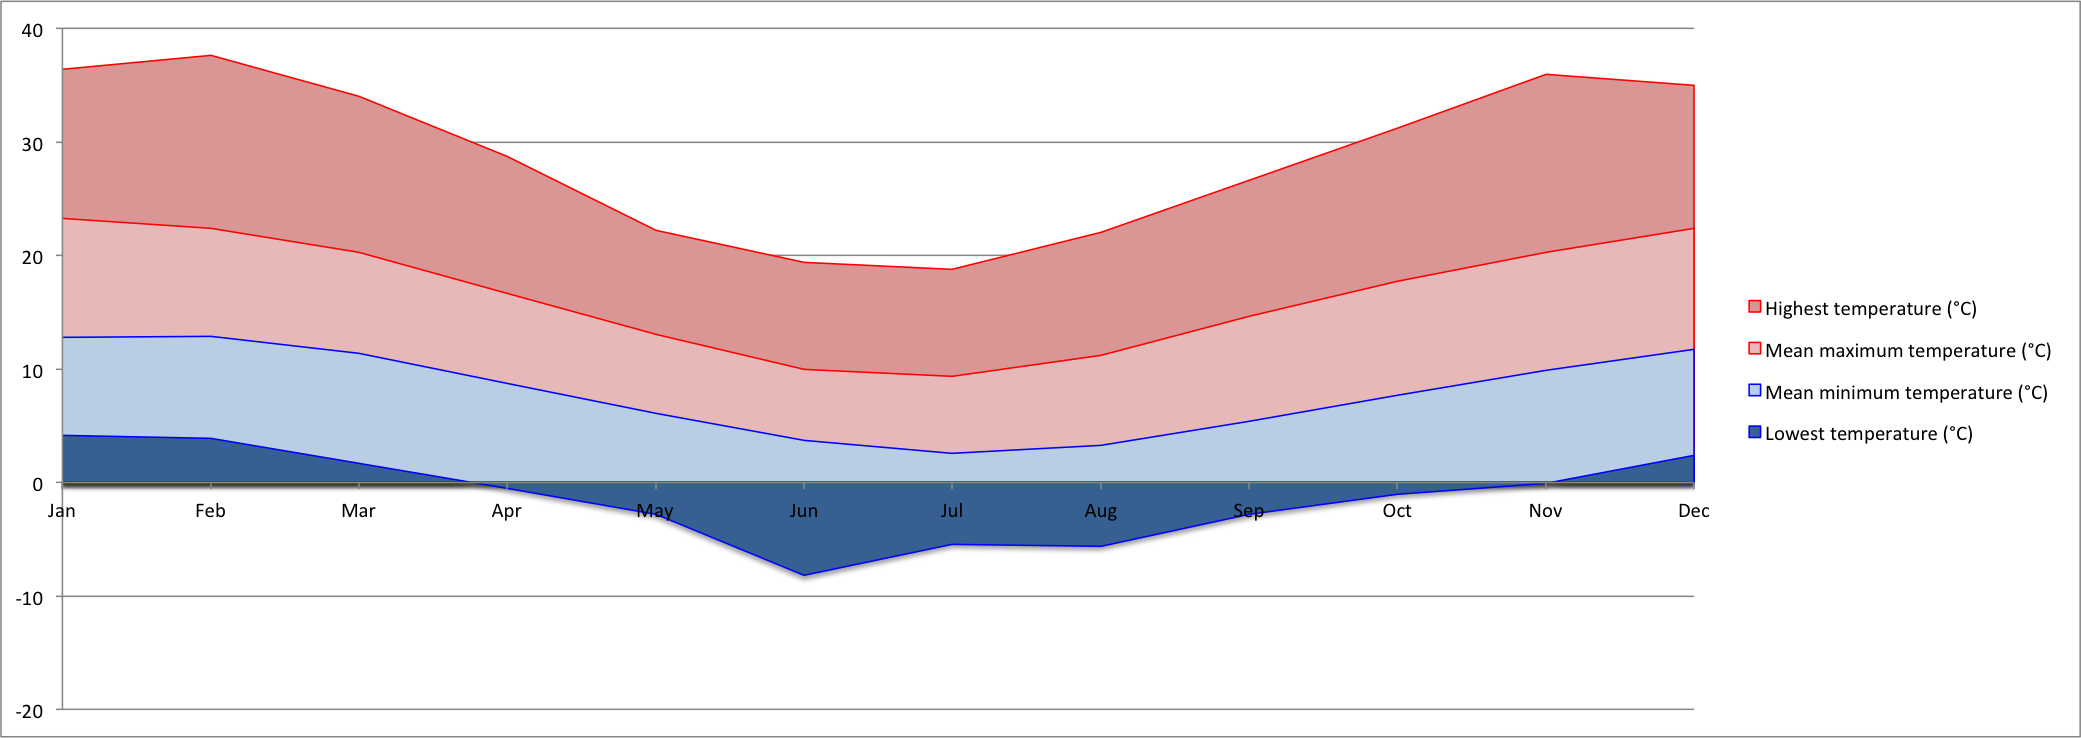
Here is a graph showing these numbers and the flow over the annual cycle from January till December. You can see how the common temperatures we experience fall into that middle section that run from about 23C down to 10C over the year during the day. This can create a challenging climate and short growing time for plants like Tomatoes, peppers and eggplants unless they are protected in some way. This just represents what is happening out in the open during the year. If you use walls, structures and enclosures you can alter this to a great degree during both the day and night. You can see we do have the occasional severe winter where the temps can drop down below zero from May to September.
Another interesting set of local statistics to consider is the recorded change over the day time. Here we see the recorded temperature change from 9am till 3pm.
| Mean temperature change over the day 9am – 3pm | ||||||||||||
| Jan | Feb | Mar | Apr | May | Jun | Jul | Aug | Sep | Oct | Nov | Dec | |
| Mean 3pm temperature (°C) | 21.4 | 20.8 | 18.8 | 15.2 | 11.7 | 8.7 | 8 | 9.6 | 12.8 | 15.8 | 18.5 | 20.5 |
| Mean 9am temperature (°C) | 16.7 | 16.1 | 14.4 | 11.5 | 8.4 | 5.7 | 4.7 | 5.9 | 9 | 12.1 | 14.3 | 16.2 |
And here it is in a graph. You can see there is not a huge variation over the year or day. i.e. the temperature tends to build at a steady rate over the day year round. This is good for planning as it shows that you can rely fairly well on predicted daytime temperatures to steadily build and fall and not have huge variations which some climates have over their seasons.

Rainfall
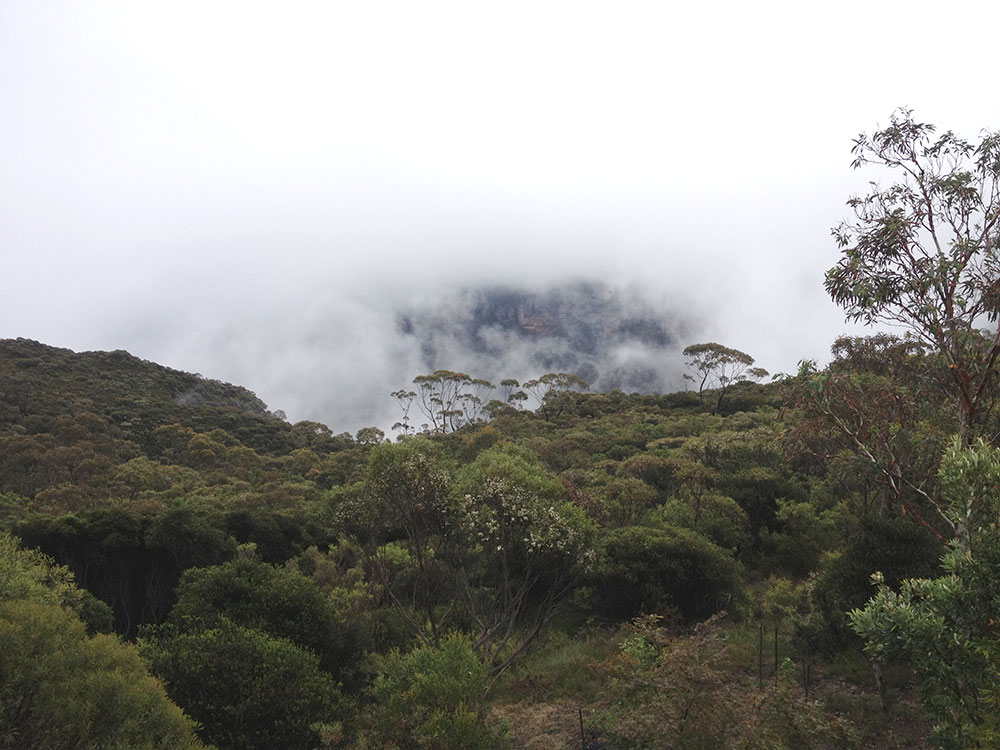
Our rainfall is fairly evenly spread across the year with some significant falls in the Summer months of Jan through till the end of March. Again this is Katoomba data. There will be local variations. It is sometimes hard to believe you are living in the same region at some times of the year driving from sunny Lapstone at the bottom of the Mountains only to reach the dense wall of fog like conditions of the upper mountains at Wentworth Falls and onwards.
| Rainfall | ||||||||||||
| Jan | Feb | Mar | Apr | May | Jun | Jul | Aug | Sep | Oct | Nov | Dec | |
| Highest rainfall (mm) | 698.6 | 787.5 | 701.2 | 624.6 | 529.6 | 696.9 | 478.7 | 580.8 | 389.4 | 445.1 | 429.9 | 410.5 |
| Mean rainfall (mm) | 162.4 | 176.7 | 165.8 | 121.3 | 100.8 | 119.2 | 83 | 79.2 | 71.8 | 91.3 | 109.1 | 123.1 |
| Lowest rainfall (mm) | 14.4 | 4.9 | 2.5 | 4.4 | 2.5 | 0.8 | 0 | 1 | 1 | 6.6 | 3.7 | 3.2 |
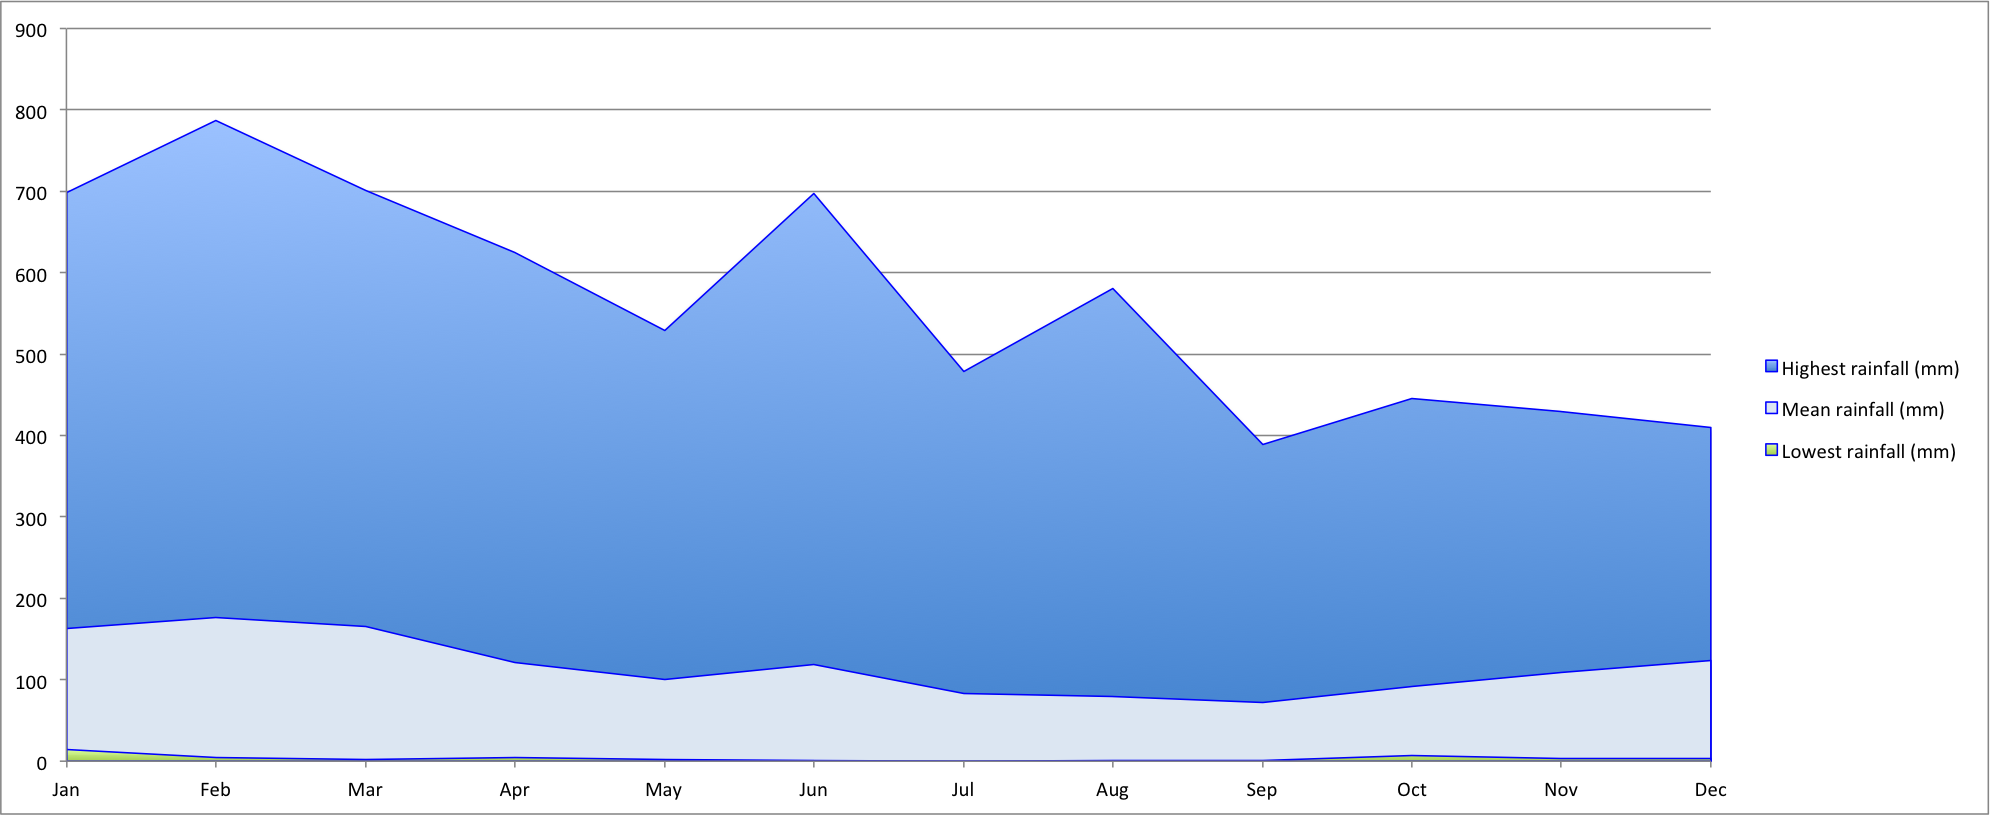
Here is a graph showing this annual cycle with the above data from January to December 1981-2015. You can see how much variation there is from the mean or average yearly rainfall and the maximum recorded falls over the last 25 years. The minimum rainfall during drought periods has historically dropped off to almost zero rainfall in some months. And when we get storms it will often drop a significant amount of extra water on the mountains as seen by the extremely high possible maximum variations. Thankfully most years we get closer to the mean with the most reliable amounts during the Months of February and March. It then gradually falls off as we move through winter into spring. That long late summer and autumn period is our best growing period where we get plenty of sun and plenty of rain.
Daylength and sunlight hours
Another useful set of data for planning what you grow and when is the length of daytime hours over the year. This variation in daylight will affect plants by for example encouraging the formation of bulbs in plants like Onions. These changes in daylight hours may promote flowering or fruiting or other stages in growth. Some plants germinate and grow better as the day length increases while others respond by flowering and fruiting – this depends on which climate and location they originate from. Another common example is the fruiting and growth and then hibernation stages in fruit trees like Apples and Pears. The simultaneous change in temperature and daylight hours will usually also reinforce these patterns by triggering other systems in the plants. Again using bulbs as an example they will often start to grow new shoots from their bulbs based on exposure to a certain number of days exposed to low temperatures – this is called Vernalization.
This variation is usually determined by the distance we are located from the equator which creates more variation between the mid summer and mid winter seasons. This is a feature of our environment and climate that does not really change as it is always determined by where we are on the earth in relation to the sun. In the southern hemisphere as you move toward the south the sunlight hours in the days get longer during the summer and shorter in winter.
For example – Onions generally need a change to a longer day length to trigger the bulb forming process in their growth cycle. This is usually around 10 to 14 plus hours of daylight depending on the variety. There is a good introductory article at Harvest to Table describing how onions grow and respond to these changes.
You can find out your Latitude and longitude and determine by date the sunrise and sunset times at the Government GeoScience Australia website:
http://www.ga.gov.au/bin/geodesy/run/gazmap_sunrise?placename=Katoomba&placetype=0&state=0#loc
If we use two dates at Katoomba:
- Around mid winter time – 1 July – Sunrise 0704 – Sunset 1701
- Around mid summer time – 1 Jan – Sunrise 0452 – Sunset 1912
This means the day length in Katoomba generally moves from 10 hours in the midwinter to around 14 hours in mid summer.
Significant cloudy or overcast conditions can affect this in some situations leading to some variation.
Moon Cycles and Gardening
There is quite a bit of scientifically researched information available now about how the moon, as it cycles around the earth, has a subtle effect on the growth of plants in the ground in much the same way that it does on the sea tides. There are many moon cycle resources available online and in print. These are worth considering in your garden planning and maintenance.
Here is one example: http://www.lunarorganics.com/moon_gardening_questions.html
This cycle will be determined by your location on the earth and the location of the moon in relation to that through out the year. So you will need to find a localised moon calendar and work from that. The Biodynamic movement uses moon planners extensively and you may find an appropriate guide on their Australian site – Biodynamic Agriculture Australia
Summary
The local climate is influenced by a large number of inputs and there is a large amount of data being collected on the local weather and general environment and it is becoming easier to access directly online – it is worth delving into it a little to make your garden and food planning and growing a little bit easier.
Many of our commonly grown vegetables and plants come from other places in the world and it’s useful to know how they will adjust to growing here by looking at some of this data and comparing it with where they originate.
Sometimes small and subtle changes can be made to make it a lot easier to grow a plant that you think you would like to grow or to get a better result.

Wow!… This is a very well written and researched article. Thanks for putting in the time to collate this information 😉
Thanks Chris! I’ll grab some of the basic weather data for other townships in the Mountains and compare that too when I get some time.